

Spring Site Information
General | Description | Surveys | Polygons | Georeferencing | Geomorphology | Solar Radiation | Extent of Data | History & Admin |
To view a spring's site information, click the Pencil Icon to open the Site Information Form (Figure 10). Within this form, there are eleven tabs that display information about the site that tend to not change over time. These include country, state, county, land ownership, Hydrologic Unit Code (HUC), USGS Quad, coordinates, elevation, geomorphology, geology, solar radiation budget, the survey history, management information, the site's sensitivity status, and an overall description of the site and its history. The following screen shots and figure descriptions explain the content and uses for each of these tabs. Watch this short video for an overview of site information.
The General Tab (Figure 10) includes locational information, such as Name, State, County, Land Ownership, and Land Unit Detail. This tab also includes basic geographic information such as USGS Quad, 8-digit Hydrologic Unit Code (HUC), alias names (AKA), and GNIS Feature ID (Geographic Names Information System). There is an option to choose the Treatment/Management Area from the drop down box. In addition, the Sensitivity status of the site designates whether the Location or Survey information are sensitive, or whether neither are sensitive, or whether both are sensitive. Some access Permissions are based on this field, along with the Land Unit Detail and whether or not the data have been published. After entering or updating data, click Save.

Fig. 10: The General tab.
The Description Tab (Figure 11) includes general descriptive information about the site that tends to remain constant over time. Access Directions are entered here. This should include challenges to accessing the site (crossing private land or climbing a cliff, for example). Also, it may include helpful details such as sensitive land constraints (Wilderness areas, etc.). When writing the site description, please use complete sentences and try to provide enough information that future surveyors could recognize the site from the description. Images and Sketchmaps of the site from the most recent survey, if it exists, also are displayed on this tab. However, they can only be uploaded in a survey; they cannot be entered from this form. In the Site Hyperlink field you can enter a hyperlink to an internet location that may offer more information about a spring. After entering or updating data, click Save.

Fig. 11: The Description tab.
The management Tab
The management tab provides a useful place for land managers to record legal information, the cultural importance of a site, and any management or restoration actions performed. The management action module allows land managers to document actions such as restoration, rehabilitation, fencing, invasive species removal, etc. After entering or updating data, click Save Edits. If you have suggestions to improve or expand the options on this page, please email jeri@springstewardship.org.

Fig. 12: The Management tab.
The Reports Tab
The Reports Tab is extremely useful once you have all the survey data entered. Here, you can generate a site summary report in Microsoft Word (Figure 13) that includes the physical characteristics, survey data, photographs, tables, and the sketchmap from all surveys associated with that site. You can also generate reports that include all data for Water Quality, Flow, Plant Species Cover, Plant Species, Vertebrate Species, and Invertebrate Species. With one click, data are exported into a *.csv file. If you want a report from only one specific survey, you can also find a reports tab within the survey table that will provide you with the survey report. You can also upload any historic reports associated with the site. This could include scans of field sheets, old reports, etc. Make sure the file name is short, descriptive, and has no spaces. Click the Browse button, enter a description of the report, browse to its location, and then Upload. These reports will then be available for download.

Fig 13: An example of the first page of a summary report.
The Surveys Tab (Figure 14) displays the Inventory Level and the Survey Status (highlighted in Fig. 14), as well as the Survey Records of the spring site. The Inventory Level allows project managers to track whether or not a site has been surveyed. Survey Status indicates the Extent of Data (EOD) most recently collected (i.e. Site Surveyed, EOD (>7).
Survey records include a display of the Date the survey data was conducted, in the format yyyy-mm-dd, the extent of data collected (EOD, a numerical value between 1 and 10 that represents a count of categories that contain data), the Project name, and the Surveyors' names. Clicking on the Date field opens the survey. There can be many surveys for each location. The list can be sorted in ascending or descending order by any category by clicking the arrow symbol in the column heading.The Date field is hyperlinked if a user has permission to access the data. Click the Date hyperlink to open a survey. Recall that a user must have permission for the Land Unit (in this case, Gila National Forest) as well as the Project (New Mexico - Pilot Study) to access the survey.
Fig. 14: The Survey tab.
The Polygons Tab (Figure 15) shows the names and any comments associated with the Polygons (microhabitats) at the site. Each polygon is given an alphabetic Code, (A, B, C...) as well as a Name. The Name should be short, unique, and descriptive. These may be applied to any number of future surveys, if appropriate. Detailed microhabitat characteristics (Soils, Vegetation, Moisture, Aspect, etc.) are not applied to the Site Polygon described here, but to the Survey Polygons described later. Should the geomorphology change, new microhabitats may be added. Click the Add Polygon button to add a new microhabitat. Should surveyors not identify microhabitats, the Entire Site is labeled Polygon X. Notice that when any data associated with a site are changed, the user name and date are recorded at the bottom of the form. As is the case throughout the database, this list may be sorted in ascending or descending order using the arrows in the column heading. Please note that you must add and label a site’s polygons here before they can be associated with a survey.

Fig. 15: The Polygons tab.
This tab (Figure 16) contains the georeferencing information, as well as access to tools that will assist users with placing springs in the proper location. Coordinates must be entered in NAD83, NAD27, or WGS84.
Please note that if the Datum field is left blank, the point will not be considered accurate and will not be exported into a geodatabase. Users should enter coordinates in Decimal Degrees. Periodically, SSI updates the UTMs and Degrees, Minutes, and Seconds based on this information, as well as Township, Range, and Quarter Section.
Elevation and Estimated Position Error should be entered in meters. If these were collected in feet, enter "ft" after the value (e.g. 4500ft), and the measurement will be automatically converted to meters. As noted previously, many springs are inaccurately mapped. Should you feel compelled to change the coordinates to correct the location, please briefly explain in the Georeference Comments, and revise the Georeference Source and GPS Unit as appropriate. After entering or updating data, click Save.
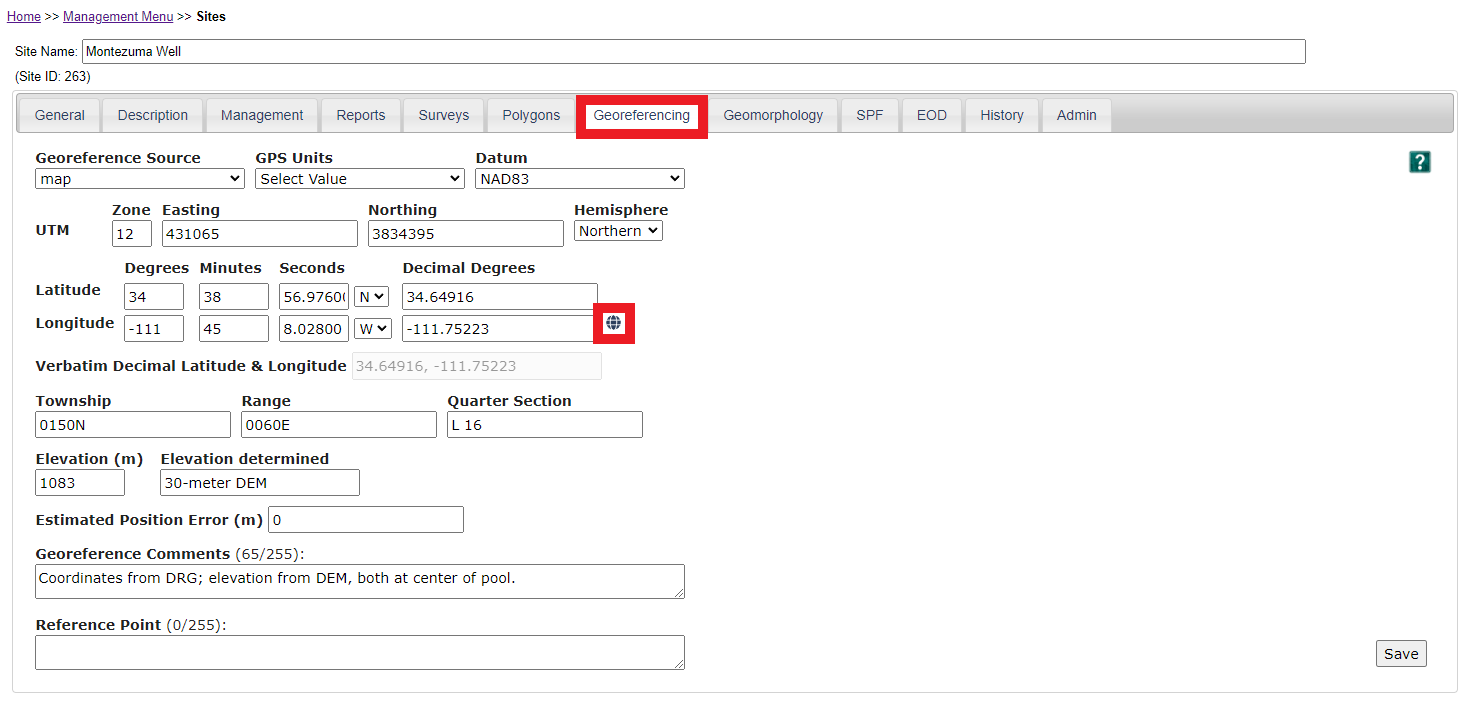
Fig. 16: The Georeferencing tab.
The mapping aid (accessed via the small globe icon next to longitude) can be very useful if the estimated position error on your device is significant. If you select the satellite layer and zoom in (Figure 17), you can often clearly see (particularly in arid lands) the source of the spring, and the point may be mapped several meters off. If this is the case, from the Draw drop-down menu, you can select Point, click the desired spot on the map, click Submit Coordinates, then hit Save to move the refined point. Please be careful with this feature though. It can be relatively easy to drag and drop points, thus moving the spring, when you do not intend to. If this happens, simply close the mapping aid and the changes will not be saved.
You can also look for nearby springs from the mapping tool by entering a search radius and clicking “Find Nearby Springs”. This is helpful with identifying duplicate springs entries. Hover the mouse over the various points to view the Spring Name and Site ID.

Fig. 17: A well-mapped spring, in satellite view.
The Geomorphology information includes the Primary and Secondary Spring Type. Also referred to as Sphere of Discharge, these include cave, exposure, fountain, geyser, gushet, hanging garden, helocrene, hypocrene, limnocrene, rheocrene, hillslope, mound-form, and anthropogenic. Generally, anthropogenic springs only emerge due to human manipulation (e.g., a mining excavation). Keys to these designations are displayed in the drop down form. They are also fully described, with example photographs and diagrams, in the Subclass Chapter 4. Although most springs have only one type of discharge sphere, some complex sites may have two or more.
Other fields on this tab include Emergence Environment, Flow Force Mechanism, Primary Lithology, and Secondary Lithology. When a Primary Lithology is entered, only appropriate Secondary Lithologies will be listed in the dropdown box for that field. For example, upon entering “Sedimentary” as the Primary Lithology, the Secondary Lithology will be limited to “sand-stone, limestone, shale, etc.” The name of the Geologic Layer and other geologic factors may be entered if known. The Soil Unit, Ecological Unit, and Map Sources are optional fields if this information is available. After entering or updating data, click Save.
The Distance to the Nearest Spring in meters will change as new springs are added. Periodically, the database administrator updates these values.
Fig. 18: The Site Geomorphology tab.
The solar radiation that reaches a site can be estimated using a Solar Pathfinder TM (SPF). This relatively inexpensive device displays the sunrise and sunset at the source. The data should be entered in 24-hour time as hh:mm. Upon entering these, click the Calculate Energy and Save Buttons to calculate the seasonal energy budget in Mj/m2 and percent of potential energy for the site. The Latitude value must be entered on the Georeferencing tab in order for this function to work. Should there be no obstruction at the site, click the No Obstruction Button to automatically enter the values. This function also requires a latitude value.
Fig. 19: The Solar Radiation (SPF) tab.
The EOD Tab also lists the Survey Date, but displays ”x” symbols that identify the categories that contain data. In this example, the 2018-06-22 survey has ten categories of information. Here the Date field is also hyperlinked if a user has permission to access survey data.

Fig. 20: The EOD tab.

Fig. 21: The History tab.
The History tab tracks the history of changes to a site record by login name and the date that the record was changed. This is useful for quality assurance and quality control.
The Admin tab enables users with Administrative permissions to change the site name or to delete sites. A site may not be deleted if there are surveys associated with it. If you have such permission, be absolutely certain before you delete a site. If it should turn out to not be a spring, it is often best to change the inventory level to “Not a Spring” on the Surveys tab. In this case, write an explanation for the change in the Site Description field on the Description tab.
The next section of the tutorial explains the process for recording individual site surveys. To open a survey, select the Surveys Tab and click on the Survey Date. This hyperlink will only be active if you have Permission to access the survey.